728x90
반응형
seaborn 그림의 폰트 사이즈 바꾸기
파이썬에서 seaborn 라이브러리로 그림을 그리다 폰트의 사이즈를 바꾸고 싶어져 그 방법을 정리해 보았다.
세 가지 방법을 정리한다.
방법 1
sns.set(font_scale = xx)
import numpy as np
import matplotlib.pyplot as plt
import seaborn as sns

x = np.random.normal(size=37)
y = np.random.lognormal(size=37)

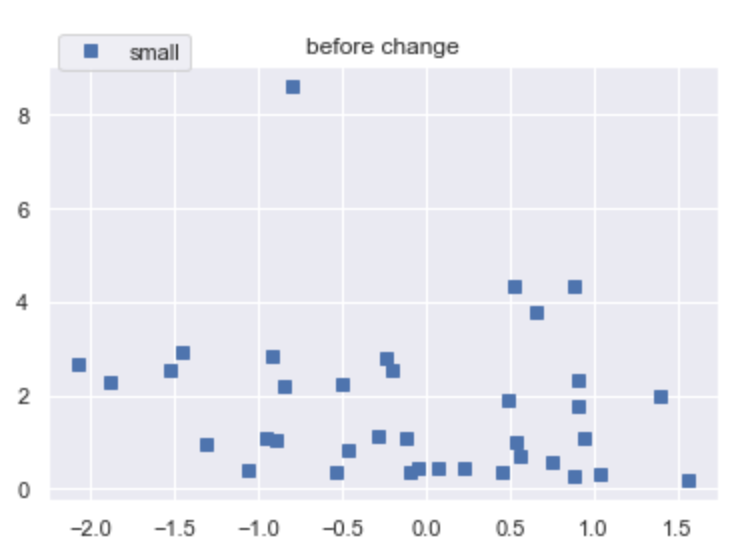
# before change
sns.set()
fig, ax = plt.subplots()
ax.plot(x, y, marker='s', linestyle='none', label='small')
ax.legend(loc='upper left', bbox_to_anchor=(0,1.1))
plt.title("before change")

------------ // -------------------------

# after changed
sns.set(font_scale=2) # 아주 크게
fig, ax = plt.subplots()
ax.plot(x, y, marker='s', linestyle='none', label='small')
ax.legend(loc='upper left', bbox_to_anchor=(0.7,1.3))
plt.title("after changed")


방법 2
플랏의 오브젝트로 바꾸기
import seaborn as sns

tips = sns.load_dataset("tips")

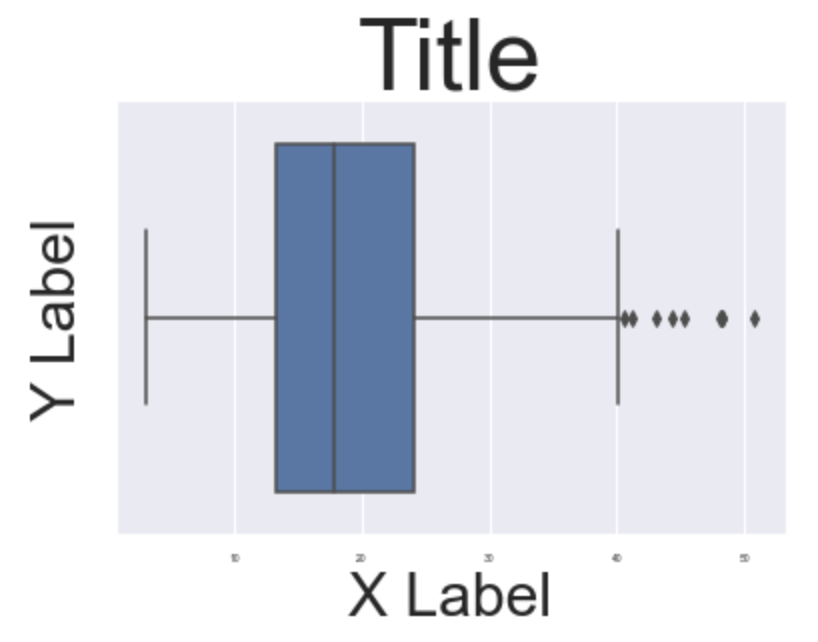
b = sns.boxplot(x=tips["total_bill"])
b.axes.set_title("Title", fontsize=50)
b.set_xlabel("X Label", fontsize=30)
b.set_ylabel("Y Label", fontsize=30)
b.tick_params(labelsize=5)
plt.show()
Colorbar의 폰트 사이즈 바꾸기
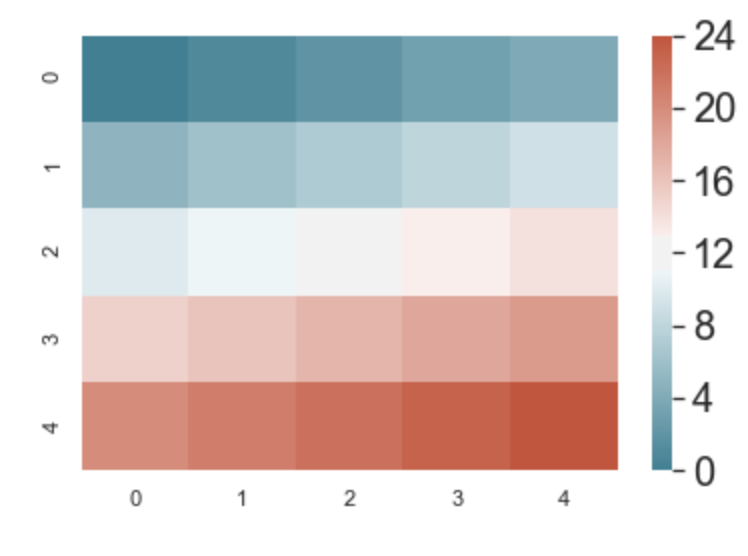
seaborn이나 파이썬에서 데이터 분석을 하다보면 heatmap과 같은 2차원 그래프를 만드는 경우가 많다. heatmap에서는 각 영역의 색이 값을 표현해주는 scalebar가 아래 그림안의 오른쪽 처럼 생기는데, 이 scalebar의 폰트 사이즈는 별로의 함수로 지정을 해주어야 한다.
#You can use matplotlib.axes.Axes.tick_params with labelsize.

#For example, your plot with labelsize 20:

import seaborn as sns
import matplotlib.pyplot as plt
from numpy import arange
x = arange(25).reshape(5, 5)
cmap = sns.diverging_palette(220, 20, sep=20, as_cmap=True)
ax = sns.heatmap(x, cmap=cmap)
# use matplotlib.colorbar.Colorbar object
cbar = ax.collections[0].colorbar
# here set the labelsize by 20
cbar.ax.tick_params(labelsize=20)
plt.show()
위 코드에서 ax.collections[0].colorbar가 coloarbar에 대한 오브젝트를 만드는 것이다. 그러고 나면 tick_params()의 객체에서 폰트 사이즈를 조절할 수 있다.

728x90
반응형
'Programming > Tips' 카테고리의 다른 글
| [Arm64] M1 맥북에 tensorflow 2.4 설치하기 (conda 환경) (1) | 2021.04.27 |
|---|---|
| [Jupyter notebook] 코드 접기 (codefolding) 설정하기 (0) | 2021.04.19 |
| [tensorflow] AttributeError: module ‘tensorflow’ has no attribute ‘placeholder’ 해결 방법 (1) | 2020.10.30 |
| [Jupyter notebook] code cell 폭 늘리기 (0) | 2020.10.30 |
| [tistory] 티스토리에 LaTeX 수식 입력하기 (feat. 수식정렬) (1) | 2020.10.30 |


댓글